
Introducing New Time Series Integration: Sharpening Wind Resource Analysis for Bankable Results
A More Precise Way to Estimate Wind Output
In wind energy development, accurate P50 estimation, LCOE calculation, and yield forecasting hinge on how well you model the wind over time. Historically, most platforms have relied on Weibull distributions—an approach that, while useful, has limitations in capturing temporal variability.
To address this, Youwind has introduced a major update to its platform: Time Series Integration. This enhancement enables developers to model wind resource inputs more realistically, improving confidence in financial modeling for wind energy.
Key Enhancements in the Wind Temporal Analysis Module
The update introduces three major advancements:
- Scenario-wide impact: Time series results now directly update P50, LCOE, and related KPIs within Youwind scenarios
- Mean of Monthly Means method: Replaces the older “median year” method to better represent seasonally unbalanced datasets
- Curtailment loss simulation: Added to existing wake loss modeling for a more complete net yield assessment

How It Works: From Raw Time Series to Bankable KPIs
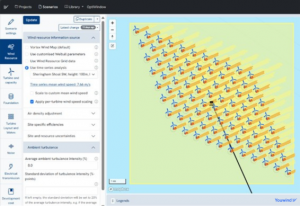
Within the Wind Resource section, users can now activate the “Use Time Series Analysis” toggle. This shifts the source of analysis from Weibull-based statistical inputs to actual time-stamped wind speed data.
Key workflow highlights:
- Upload time series to the Time Series Locations library
- Frequency distribution charts are generated and used for yield calculations
- Scenario production values auto-update with gross and net yields from the time series
- All outputs are reflected in the Wind Temporal Analysis and Finance sections for traceability
This shift is especially valuable in early-stage bankable yield assessment, where site-specific measurements (e.g., Lidar or met mast campaigns) are limited to 1–3 years.
Methodology Update: Why Monthly Means Matter
Previously, Youwind derived long-term production from the median year in the dataset—effective, but sensitive to unbalanced short-term data. The new approach:
- Computes average power per timestamp
- Aggregates to a monthly mean value
- Multiplies by average month length to get monthly energy
- Offers more robust results for shorter time series—a common scenario in real-world measurements
This method improves reliability when using limited field data, and helps align yield projections with real-world seasonal variations.
Why This Matters: Reducing Uncertainty in Wind Energy Planning
Incorporating time series into your modeling pipeline enhances:
- Data-driven decisions in wind energy
- Scenario comparison for wind farms
- Bankability of yield assessments with better representation of variability
- Transparent alignment of energy modeling with financial projections
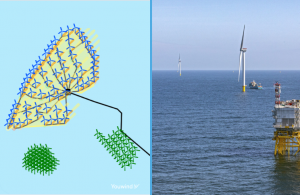
The update is especially relevant for offshore wind farm developers navigating complex meteorological regimes or aiming to de-risk early-stage investment discussions.
Final Thought: Wind Doesn’t Blow Statistically—It Blows in Time
By integrating granular, timestamped wind data, Youwind’s platform helps bridge the gap between resource variability and financial confidence. The Time Series Integration empowers teams to move beyond approximations—and toward reliable, scenario-based planning.
Request a demo
Get a first-hand look at how Youwind can support your wind energy management and development, whether onshore or offshore. Fill out the form and we’ll be in touch to schedule your personalised demo.
Related Knowledge
 October 14, 2025
Digital Twins: Shaping the Future of Wind Energy
In the world of wind energy, every project is a complex puzzle. From onshore terrains filled with environmental and technical constraints to distant offshore sites influenced by neighboring projects, developers and operators face a constant battle against uncertainty. For years, the industry relied on fragmented…
 October 9, 2025
GIS Spatial Data for Smarter Wind Farm Planning
In the development of any offshore wind farm or onshore wind farm, spatial data isn’t just helpful, it’s fundamental. From early-stage site screening to late-stage permitting and financing, developers need accurate, high-resolution geospatial intelligence to evaluate constraints, reduce risk, and accelerate time-to-build. At Youwind, we’ve…
 September 23, 2025
Horizontal Extrapolation in Time Series: Precision Wind Resource Assessment for Every Turbine
Understanding wind behavior at the turbine level is critical to achieving a reliable wind resource assessment, a key driver for reducing uncertainty in both onshore wind farm and offshore wind farm development. Youwind introduces horizontal extrapolation during time series analysis, empowering users to adjust and…