

Windletter by Youwind – Designing and breaking down the numbers of floating wind in the UK (part I & II)
In this two-part article, originally published in his newsletter Windletter, Sergio Fernández Munguía uses Youwind to design a hypothetical 300 MW floating wind farm in the Celtic Sea from scratch. He explores each key design decision, from site selection and turbine choice to floaters, moorings, layout and electrical infrastructure.
He then runs the numbers for this UK case study: How much would the project cost? What strike price would it need? And what would it take for floating wind to become competitive?
Read the full article below.
Simulating the numbers of floating wind in the UK
On 14 January 2026, the UK published the results of the largest offshore wind auction in its history: 8,437.5 MW awarded in the seventh Contracts for Difference allocation round. Fixed-bottom offshore wind cleared at £91.20/MWh (8,245 MW), while floating cleared at £216.49/MWh (just 192.5 MW), all in 2024 prices.
That’s a gap of £125.29/MWh. Almost two and a half times the fixed-bottom price, with the same supply chain, the same turbine technology and the same regulatory framework. By the way, the administrative strike prices, that is, the caps above which no contract is awarded, were £271/MWh for floating and £113/MWh for fixed.
But where do those numbers come from? Why does floating need that price? Since we have access to Youwind’s web-based software, we set out to simulate a case as close to reality as possible.
Disclaimer: The figures in this article come from our own simulation of a hypothetical site, with costs taken from public sources. They do not represent any real project or any developer’s figures.
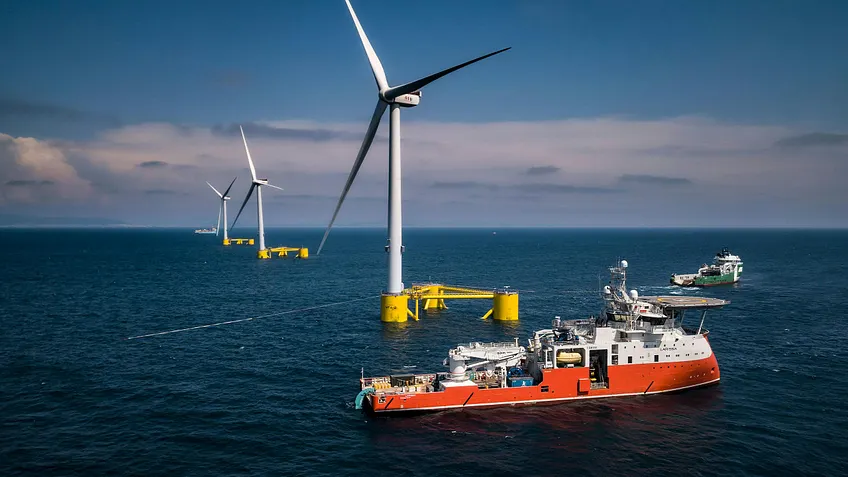
Location
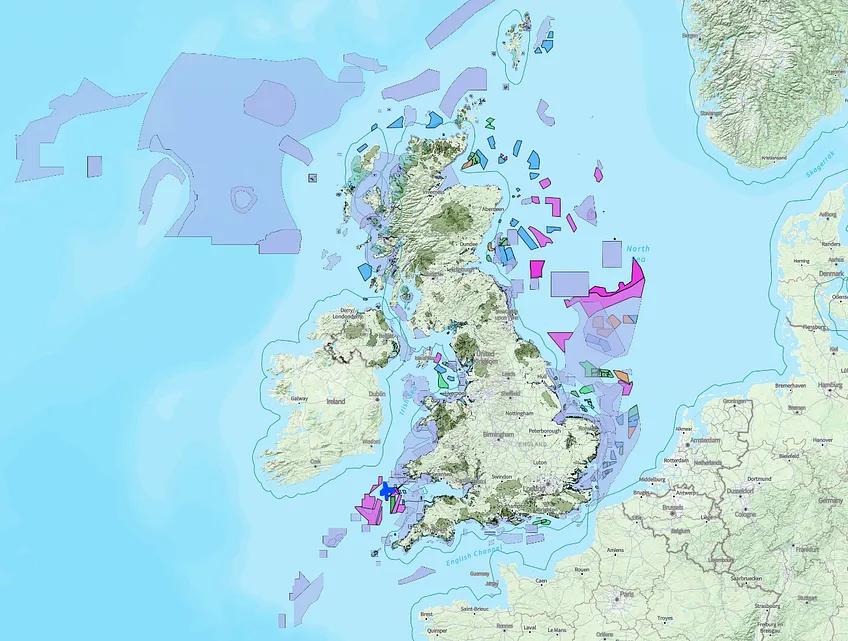
The first thing we need to simulate our wind farm is a location. Youwind’s tool is particularly interesting for site screening, as it lets you view the world map with the relevant layers: wind resource, environmental constraints, seabed depth, areas designated for offshore wind, existing wind farms and other infrastructure, ports, substations, etc.
Youwind comes with a range of preloaded layers, both global and country by country, but users can import as many as they need. In the UK, the world’s leading market excluding China, the available layers give a sense of how large and active the market is.
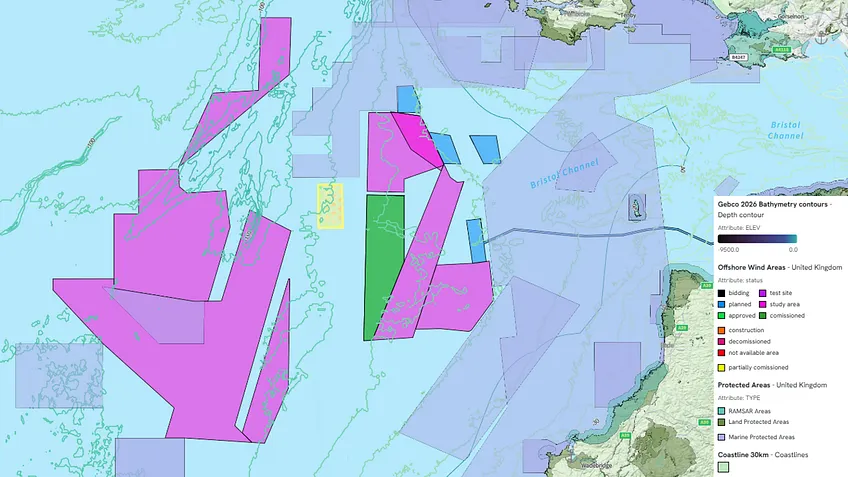
In our case, taking advantage of the fact that it’s an area with a lot of development activity but still free of wind farms, we chose a zone in the Celtic Sea, where we also confirmed there is a good wind resource.
To avoid overlapping with any existing development or stepping on any developer’s toes, we chose an 85 square kilometre area located west of the Round 5 Project Development Areas.
Next, we defined the wind farm’s rated capacity. Here we chose 300 MW, because it’s the minimum size The Crown Estate set for each project or phase within the Round 5 PDAs, which can be developed in up to three phases of 1.5 GW total capacity.
A very interesting feature of Youwind is that, simply by defining an area and a rated capacity, the screening function already gives you the key data to judge how attractive it is: average depth, mean wind speed along with the wind rose, power density (MW/km²), estimated LCoE, etc. This is ideal at greenfield stage, as it lets you compare the potential of different areas in just a few clicks.
According to the screening function, our area has the following characteristics:
- Average depth: -88.9 m. Unless the user provides other information, the platform relies on GEBCO data and assigns a depth to each position. In this case, depth ranges from 85 to 91 metres, beyond what is viable for fixed-bottom (at least for now), but “shallow” for floating.
- Mean wind speed at 150 metres: 10 m/s. Youwind offers four routes for wind resource. The first is the Vortex FDC map at roughly one-kilometre resolution and 16 sectors, which is the default. The second is Global Wind Atlas 4.0, with 12 sectors. The third is to download the ERA5 series closest to the site directly, in one click. And the fourth, the one you’d use on a more advanced project, is to upload your own data: a WRG file, your own Weibull parameters, a frequency distribution (.tab) or a time series if you have a measurement campaign. In this case, we used the Vortex FDC data.
- Area: 85 km². Total area of the selected surface. Here it was a polygon drawn freehand by yours truly, but any polygon from another source could be uploaded.
- Power density: 3.53 MW/km². The value is somewhat below the 4.1 MW/km² The Crown Estate used to plan the round itself, which in principle helps reduce wake losses.
Technology: turbine, floater and moorings
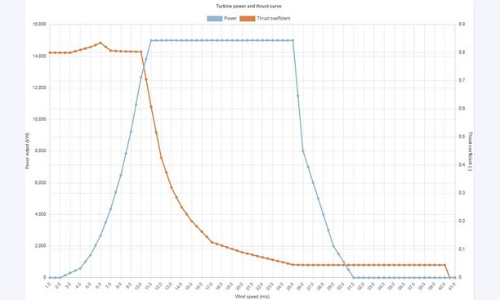
The next step is to choose the technology for our wind farm. To stick to public information, we went for the IEA-15-240-RWT turbine, with a 240-metre rotor, a hub height of 150 metres above sea level, and IEC class 1B. For those who don’t know it, it’s an open reference design commonly used in both R&D and academia. Its power curve is as you can see on the image below.
As you can see, it closely resembles the Vestas V236-15.0MW and the SG14.0-236 DD, although with a slightly larger rotor (240 m).
The platform includes the turbine as a preset, but the interesting part is that you can define your own turbine or change whatever you need: rating, diameter, hub height, power and thrust curves, availability, blade degradation, power curve uncertainty, price, design life, installation days per position, and the weights of nacelle, blades and tower.
Here, the logical thing is for developers to enter the data provided by manufacturers, so they can quickly compare one model with another.
After choosing the turbine, we move on to foundations. For fixed-bottom wind, Youwind can calculate their length for each turbine position. Based on internal calculations, it can also estimate the weight of monopiles and jackets, which, combined with the steel price, helps produce a good cost estimate. The better the inputs, the better the outputs.
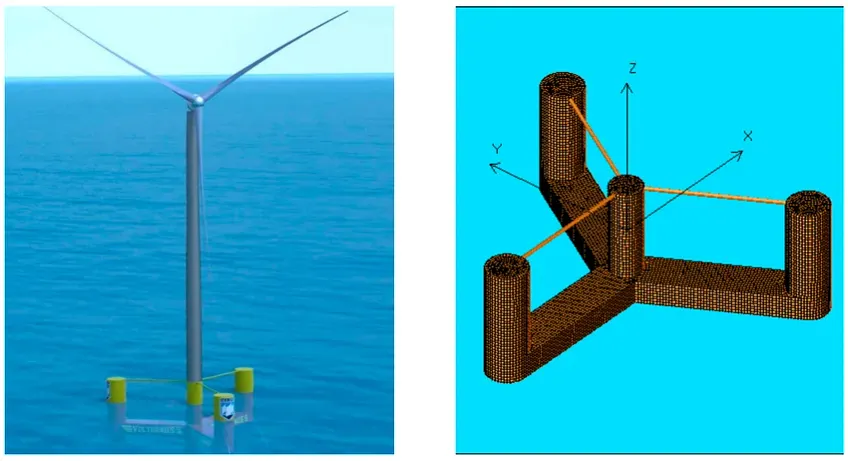
For a floating case like ours, we went for the UMaine VolturnUS-S platform. It’s a steel semi-submersible that NREL defined as an addendum to the IEA-15-240-RWT turbine. In total, based on the available literature, we defined 4,014 tonnes per position between hull and tower interface. Ballast (typically concrete and seawater) and its cost can also be defined.
Finally, there is the mooring system. Here, once the system is defined (3 or 6 catenary lines per position, for example), the software can calculate the length of each line, as well as the cost if the unit price per metre is entered. In our case, we selected 3 catenary lines per position.
Generating the layout
With turbine, floater and mooring defined, it’s time to place the machines at sea. For 300 MW at 15 MW per turbine, that means 20 positions. This is where Youwind really shines, as it lets you design and compare different layouts automatically in a few clicks and without long simulation waits.
To generate a layout, the software lets you choose the objective, which is no minor detail because each objective produces a different wind farm:
- Maximise spacing for a given area and number of turbines.
- Maximise capacity for given turbine spacings.
- Minimise wake losses for a given spacing and capacity.
Depending on the strategy and constraints of our development, one option or another will make more sense. Beyond that, you choose a regular or staggered grid, set spacings in rotor diameters, decide how many turbines go in each row, set the minimum distance to the area boundary, and can let the algorithm optimise the orientation angle of the wind farm, which will normally follow the prevailing wind direction in the wind rose.
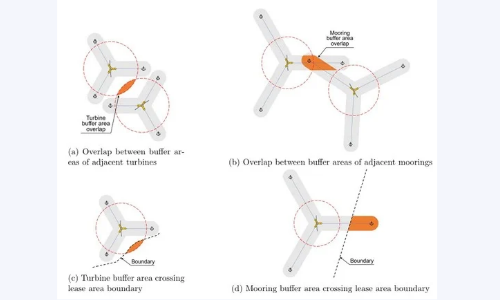
When generating the layout there are some interesting particularities for floating wind. A very relevant one is the mooring footprint radius, which is the distance between the turbine and its anchors measured in plan view.
In this case, according to the software’s calculations, the mooring footprint radius ranges from 373 to 399 metres, depending on the depth at each position. This means two neighbouring turbines need close to 800 metres of separation just to keep their moorings from overlapping. The same applies to the boundaries of the selected area. Can the mooring sit outside the area? And the blade overhang? The graphic below makes it perfectly clear.
The greater the depth, the larger the mooring footprint radius, so there could be cases where turbine spacing is driven by it rather than by wind resource or turbulence, as is usually the case. In any event, all of this can be configured as constraints when generating the layout.
With all the constraints defined, we can proceed. In our case, since we gave the software an unconstrained 85 km² surface, we asked it to maximise turbine spacing, which in principle will give us the best AEP (Annual Energy Production).
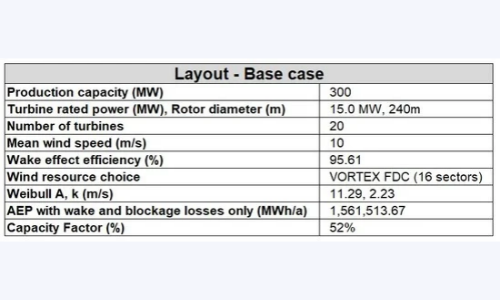
And the main metrics are as shown below.
Of course, spreading turbines apart comes at a cost: on the one hand, array cables will inevitably be longer, which means higher costs and higher electrical losses; on the other, some turbines may end up in deeper water, increasing the cost of the mooring system. Fortunately, if you have all the costs modelled, comparing scenarios is easy.
Once a base layout is defined, Youwind has a tool for optimising positions using a genetic algorithm, which iterates until it finds the optimal case. According to Youwind, these algorithms are unique in the market at a commercial level and expand the options beyond the accepted and widely used gradient-based algorithms.
A very important issue in offshore development today is the wakes generated by neighbouring wind farms, both existing and future. Youwind lets you model those wind farms and include them in the calculation. We’ll look at this in detail further on.
Other: environmental impact, installation, DEVEX, O&M
Other functions the software offers, but that we won’t cover in detail now because the article would get far too long, relate to environmental impact, logistics and installation, and operation and maintenance.
Youwind lets you run, in just a few clicks, preliminary studies of:
- Noise: especially critical onshore, the software calculates noise propagation to check the impact on neighbours or nearby points of interest.
- Visual impact: critical both onshore and offshore, it estimates from where the wind farm will be visible depending on distance and terrain.
- Shadow flicker: the well-known phenomenon of the shadow the blades can cast on people.
In addition, the platform lets you define the port and installation vessels, for both foundations and turbines. Depending on how granular the user’s data is, you can simulate the vessel model, mobilisation costs, crane hire, fuel, vessel day rates…
On top of that, a function called OptiWindow lets you include weather windows and analyse logistics scenarios in more detail.
As for O&M, its cost can also be modelled across different items over the life of the asset (turbines, logistics, technicians, inspections, insurance…). And for development costs or DEVEX, far from negligible in this type of project, Youwind lets developers enter specific figures or estimate them as a percentage of CAPEX.
Electrical infrastructure
As for the electrical infrastructure, Youwind also lets you model it in a simplified way:
- The onshore substation where the wind farm exports its electricity.
- The offshore substation where the turbine output voltage is stepped up (typically from 66 kV to 220 kV).
- The export cable, the high-voltage cable connecting the onshore and offshore substations.
- The array cables, the wind farm’s internal cables forming the turbine strings.
On the substations, the most interesting part is the ability to model cost, availability, efficiency and also the need for and size of the shunt reactors that compensate the reactive power generated by the export cable. There is also a function to place the offshore substation in an optimal position (normally the geometric centre of the wind farm for an unconstrained layout).
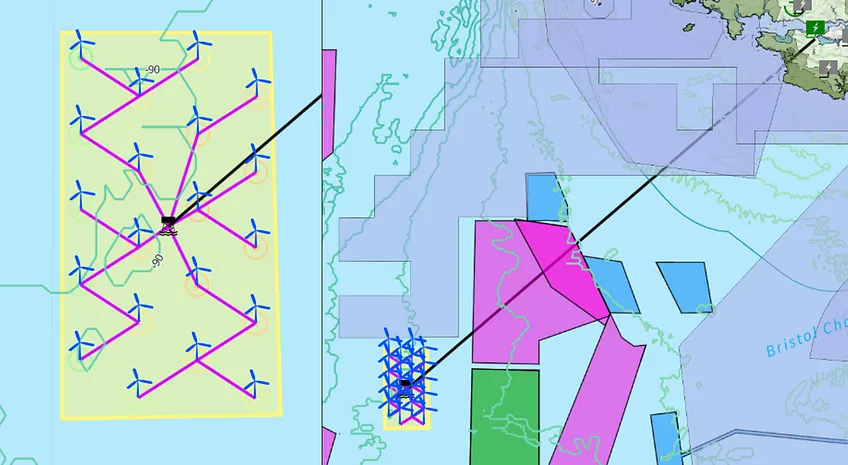
On the cables, a particularly interesting function is that the software can automatically generate, based on user guidance, a cable routing and string grouping, calculating cable lengths for both array and export.
Naturally, if the user has a more detailed routing, it can be uploaded. Cable efficiency and availability can also be modelled so that they are taken into account in the AEP calculation.
In our exercise, since we included no exclusion zones, the cables have a fairly regular design.
Simulating the numbers of floating wind in the UK
We now have a 300 MW wind farm designed and placed on the map: 20 turbines of 15 MW on floaters, spread as far apart as possible within 85 km², and with its electrical export infrastructure.
And now it’s time to talk money: how much does it cost, how much does it produce, and what price would it need for someone to want to build it? In the AR7 auction, the answer was £216.49/MWh.
Disclaimer: The figures in this article come from our own simulation of a hypothetical site, with costs taken from public sources. They do not represent any real project or any developer’s figures.
Costs: what are the project’s CAPEX and OPEX?
With the whole wind farm defined at engineering level, what remains is to define its cost, both the initial investment (CAPEX) and over its lifetime (OPEX).
Since we’re not a developer and this is a theoretical exercise, we turned to public sources to try to build a reasonable and realistic cost. And the truth is we’re in luck, because there’s a reference that’s hard to beat.
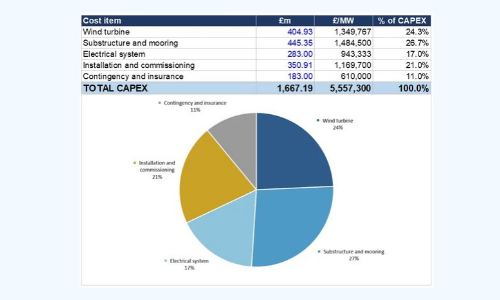
We modelled all costs based on the Guide to a Floating Offshore Wind Farm by BVG Associates, published together with ORE Catapult, The Crown Estate and Crown Estate Scotland, which gives the full breakdown of a 1 GW reference floating wind farm in real 2024 pounds: turbine, substructure, mooring, cables, substations, installation, contingency, OPEX and decommissioning. We didn’t nail it, but we came very close: 94% of the reference.
So our final CAPEX is £5,557,300/MW, or £1,667.18m for the 300 MW. As you can see, the floating substructure and mooring system are the largest item, even ahead of the turbine itself. In a fixed-bottom wind farm that almost never happens.
For the financial model, we also modelled:
- DEVEX: £46.54m, or £155,100/MW, paid over the years of development. Here we assumed 5 years.
- OPEX: £29.45m per year, around £98,200/MW per year over the whole life of the project.
- Decommissioning (ABEX): a single payment of £134.97m at the end of the operating life.
From cost to strike price: financing, target return…
With the wind farm built and costs settled, we can head for the number everyone looks at. But first we need to solve the other half of the equation: how much energy the wind farm produces.
Youwind calculates the full energy balance following the IEC 61400-15 framework, which is not a single loss figure but a list of categories to be filled in and defended one by one: wakes, turbine and balance-of-plant availability, electrical efficiencies, blade degradation, curtailment and site-specific factors.
For our wind farm, with the layout we generated:
GROSS AEP: 1,633,284 MWh
NET AEP P50: 1,384,997 MWh
OVERALL EFFICIENCY: 84.80%
GROSS CAPACITY FACTOR: 62.15%
NET CAPACITY FACTOR: 52.70%
Wake and blockage losses come in at 4.39%, a low value consistent with having maximised spacing. And that 52.70% net capacity factor is the key figure: production at the connection point, net of wakes, availability and electrical losses.
And here comes the part that gets little attention and deserves more: percentiles.
P50: 1,384,997 MWh
20-YEAR P90: 1,251,336 MWh
A 9.65% drop from P50 to P90. It’s important to note that we have no measurement campaign: our resource comes from a mesoscale map, not from a met mast or a lidar. A bank doesn’t lend against P50, it lends against P90. If you want a P90 with more certainty, you have to go out and measure.
With production and costs in hand, we can calculate the price we need to make the wind farm viable. So the question is: what is a reasonable return for a project with this level of risk?
Once again, we turned to public references. A report commissioned by the Department for Energy Security and Net Zero (DESNZ) from Cambridge Economic Policy Associates (CEPA) estimates hurdle rates for each technology: the minimum return below which an investor won’t enter a project. It’s not exactly the same as the cost of capital, but it is the rate at which cash flows should be discounted if you want to know what price a project needs to be investable.
For floating offshore wind, classified as high risk, the whole-life hurdle rate is 11.40% real, pre-tax. To put that in perspective: for fixed-bottom offshore, considered medium risk, it’s 8.90%, and for onshore, 7.60%.
We used 11.40%. And Youwind lets you do something very useful: instead of entering an energy price and seeing what return comes out, you give it the target return and it gives you back the price the project needs to achieve it. For this we assumed an operating life of 25 years: the first 20 under the support tariff, like the AR7 CfD, and the rest selling at market at £64.98/MWh (our own assumption).
With that in mind, according to Youwind’s calculation the strike price you would need to bid in an auction is:
£217.97/MWh.
For reference, AR7 cleared floating at £216.49/MWh for two pre-commercial projects of 100 and 92.5 MW. A difference of 0.7%.
And here comes the interesting part. We repeated the exercise with the other two rates CEPA provides (8.90%, equivalent to fixed-bottom offshore, and 7.60%, to onshore), without touching a single cost: same steel, same mooring, same vessels, same OPEX and same production. The only thing that changes is the price at which the money comes in.
Target return 11.40% (floating, high risk) → strike price: £217.97/MWh.
Target return 8.90% (equivalent to fixed-bottom offshore) → strike price: £178.76/MWh, 18.0% lower.
Target return 7.60% (equivalent to onshore) → strike price: £160.30/MWh, 26.5% lower.
Almost £40/MWh between the first case and the second, and £58/MWh between the first and the third. Without making anything cheaper at all. Although nobody expects floating to ever be on a par with onshore.
In any case, the actual gap between floating and fixed in AR7 was £125.29/MWh, and those £39/MWh of risk premium explain a little under a third of it. But it does tell us that anything that reduces perceived risk (operating track record, a consolidated supply chain, longer contracts) moves the price as much as major engineering decisions.
Conclusions by Sergio Fernández Munguía
I started this article not knowing how to use the Youwind platform, without being a floating wind engineering expert, and with no idea of the CAPEX or the business model of a floating wind farm. A few hours later I had arrived at £217.97/MWh, within 0.7% of the actual auction price in the UK. With all the limitations of the exercise, which are not few.
And I think that’s one of the most interesting facts in the whole article: it was done by one person, in a few hours, using only published information. A few years ago, an exercise like this would have been a commission for an engineering firm, which would have used several different tools and countless tedious Excel files.
Where the hours went, by the way, was not in operating the software. It was in deciding on and defending the inputs: where the floater weight comes from, what steel price is reasonable, how many catenary lines per position, what discount rate fits this technology…
And there’s something I didn’t expect to feel: the platform has something of a video game about it. It’s very visual and lets you iterate fast, so you change a turbine spacing, hit generate and instantly see how AEP, wake losses and LCoE move… For a screening phase, where what you need is to compare many options quickly, it’s ideal.
There are many features left for me to explore: the layout optimiser, neighbouring wind farm wakes, the onshore module, the BESS module, etc. We’ll cover them little by little throughout the series.
Request a demo
Get a first-hand look at how Youwind can support your wind energy management and development, whether onshore or offshore. Fill out the form and we’ll be in touch to schedule your personalised demo.
Related Knowledge
 September 30, 2026
Youwind Newsletter October 26 Edition
Welcome to the October edition of the Youwind newsletter Each month, we’ll bring you the latest key developments in wind project design, product updates from our platform, company news, and a look at what our team has been working on. You’ll also find upcoming webinars,…
 August 13, 2026
Youwind and Orkuveitan Partner to Advance Wind Energy Development in Iceland
As Iceland continues to explore new pathways for renewable energy growth, the ability to move wind projects from concept to reality efficiently while making informed, evidence-based decisions has never been more important. For Orkuveitan (Reykjavik Energy), one of Iceland’s leading energy companies, technology is a enabler in this effort. Orkuveitan has adopted Youwind’s digital wind…
 August 10, 2026
Youwind Newsletter September 26 Edition
Welcome to the September edition of the Youwind newsletter Each month, we’ll bring you the latest key developments in wind project design, product updates from our platform, company news, and a look at what our team has been working on. You’ll also find upcoming webinars,…